Archive for the ‘Market Report’ Category

February 28, 2014 — Contrary Signals at Record Highs

Sunday, March 2nd, 2014

small latest logo

+3 +3 -1  FREQ 02282014

SADJ GAIN LESS THAN .3 PERCENT   02282014

With prices hovering just below record highs one day, and just above record highs another day, the question of ‘where is this market going’ is on the front burner. Indeed, with this expansion now at 1,251 days setting a new length record every day, the question of ‘how long can this bull market last’ is most pertinent.

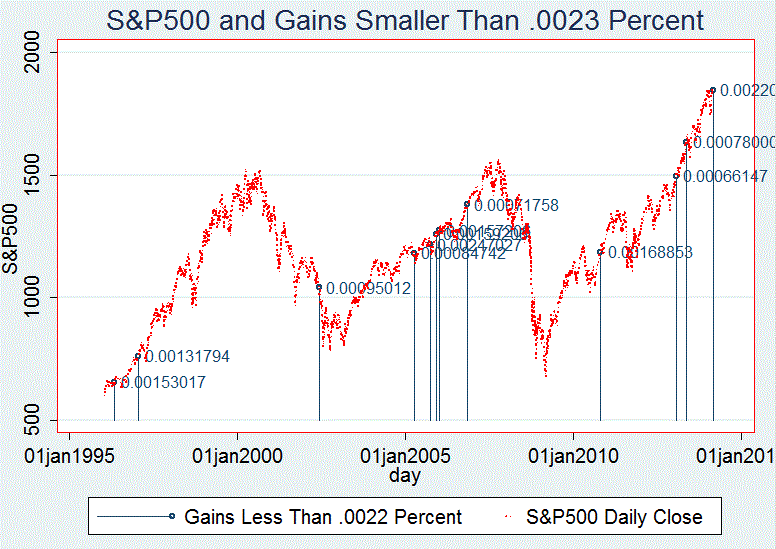
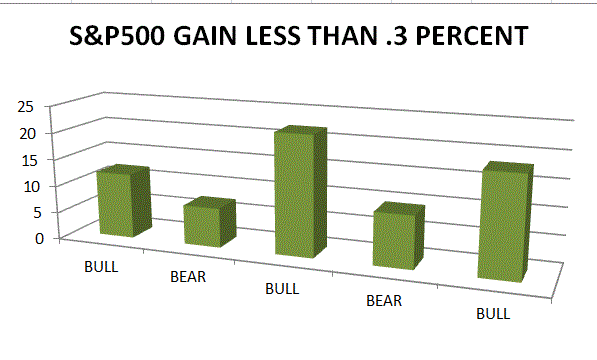
Yet we find today’s action yielding two opposite signs. The good news is the relatively modest gain of the S&P500. At just .3 percent, the record shows that advances this small occur more often in bull markets. The first diagram shows these small gains in rising and falling markets. They are near twice as common when prices are rising.

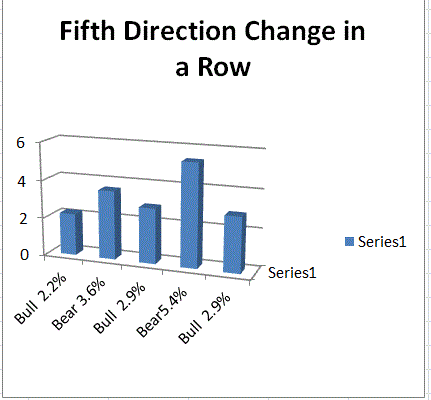
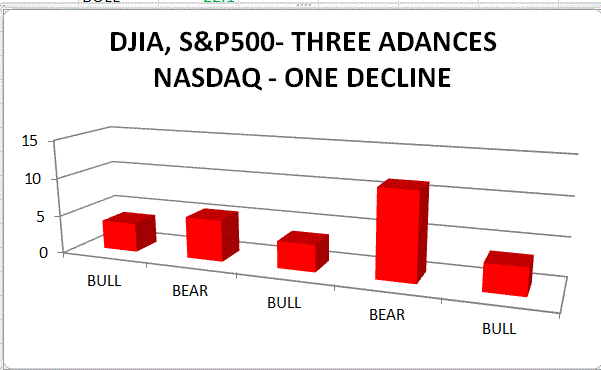
The negative indicator, shown on the second chart, considers today’s pattern of three gains for the DJIA and the S&P500 combined with a decline of the NASDAQ. It reveals this combination is far more frequent in bear markets; in fact, the ratio of bear to bull market occurrence is also around two to one.

The two faced position of these two indicators reflects the indecision of the current outlook, leaving future price formation in doubt.
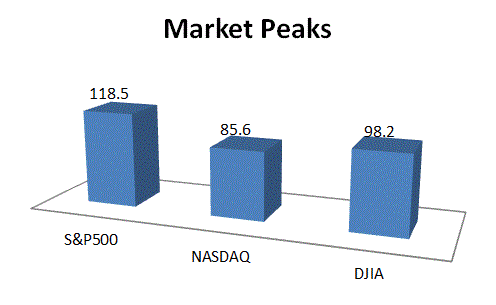
DJIA .30 percent
NASDAQ -.25 percent
S&P500 .28 percent

c max moszer

February 27, 2014 — The Beat Goes On

Friday, February 28th, 2014

small latest logo

market peaks  02272014

The market’s enthusiasm continues to push prices to new highs. The S&P500 now stands at 118 percent of its previous, 2007 bull market top. The NASDAQ is near to approaching its all-time, dotcom high of 5048. However, the DJIA, once the market’s basic measure, is falling behind, at 98 percent of its recent high.

DJIA .46 percent
NASDAQ .63 percent
S&P500 .50 percent
c max moszer

February 26, 2014 — Market Continues Daily Direction Changes

Wednesday, February 26th, 2014

small latest logo

srate gains smaller than .0023 percent  02262014

Prices remain locked in a daily seesaw, now in its sixth day of alternating gains and losses. The pattern is not much different from yesterday, though price changes were even smaller than the day before. The rate of gain for the S&P500 is so minute, that the board has it at zero percent, though the actual rate comes out to .0022 percent.

Today’s diagram locates each of these days over the last five price cycles. It shows no trend or tendency to occur before major price fluctuations.

DJIA .12 percent
NASDAQ .10 percent
S&P500 .0022 percent
c max moszer

February 25, 2014 — Small Changes Mark Fifth Direction Change

Wednesday, February 26th, 2014

small latest logo

-1 +1 -1 +1 -1 fifth direction change   02252014

Prices backed off yesterday’s highs as the market reversed itself for the fifth time in as many days. This seesaw pattern is more typical of down moves than of rising valuations.

The diagram reveals that such series occurred once in twenty days during the 2007/2009 decline; in stark contrast, that frequency was just once every 45 days in the 1996/2000 bull market. That ratio is once per 34 days in the current, since 2009, expansion.

As for tomorrow, the chances for another reversal are about the same as for a further decline. In the past, positive days followed this series almost as often as negative sessions. The proportion of next-day price increases ranges from 44 percent in the 2000/2003 decline to 65 percent in the 1996/2000 rise.

DJIA -.17 percent
NASDAQ -.13 percent
S&P500 -.13 percent
c max moszer

February 24, 2014 — NASDAQ at 14 Year High

Monday, February 24th, 2014

small latest logo

nasdaq over 4297.97   02242014

Is celebration or caution the byword as the NASDAQ, now just short of 4300, closes at a price not seen since 2000. Our diagram illustrates the two faced aspect of this near record setting day. It shows the NASDAQ’s steep rise in 2000, in step with the dot-com boom, and then prices plunge. They dropped from 5048 down to 3321, in just 15 days.

Yes, there was an immediate recovery, but it was short-lived, as the market continued its free fall for the next two years.

This surely is a different market than the speculative craze that was the way of life in 2000. Interest rates are down, as the Fed has been accommodating to get the economy going again. Yet at 1,247 trading days since the 2009 low, this bull market is mature.

DJIA .64 percent
NASDAQ .69 percent
S&P500 .62 percent

c max moszer

February 21, 2014 — Market Fluctuations

Saturday, February 22nd, 2014

small latest logo

sfr in February 2010 - 2014    02212014

Prices changed direction again, declining after rising the day before. Given this bull market’s age and its clustering just below its January record high, we consider the pattern of daily price changes. The diagram shows the ‘frequency count’ in February for each of the past five years.

Reviewing this record reveals much similarity. The vertical axis shows the number of days prices move in the same direction, both up and down. The length of the horizontal lines indicates the number of days of the move.

Note that this year has the smallest distance, or the shortest line, at both plus one and minus one. This indicates that changes in the opposite direction –that is daily ups and downs- for 2014 are far less frequent than in any of the last four years. Accordingly, conclusions that daily price fluctuations indicate an imminent change in direction are inconsistent with the record.

DJIA -.19 percent
NASDAQ -.10 percent
S&P500 -.19 percent
c max moszer

February 19, 2014 — Down Day

Wednesday, February 19th, 2014

small latest logo

-1 -2 -1  after 3   2   8                 02192014

The DJIA fell for the second straight day; the S&P500 and the NASDAQ also declined –with the NASDAQ ending its eight-day winning streak. This combination occurs somewhat more often when prices are heading down. The diagram reveals that the frequency in a bear market is greater than their occurrence in the following bull market.

Prices on the following day decline more often than they rise, during declines, while the opposite happens when prices move up. Next day increases outweigh declines three to one in the 2003/2007 expansion and in this recovery that dates back to March 2009.

DJIA -.56 percent
NASDAQ -.82 percent
S&P500 -.65 percent
c max moszer

February 18, 2014 — Prices Beating January Peak

Tuesday, February 18th, 2014

small latest logo

25 days after high cyc 0 2 and 4

The evidence keeps mounting that the January high does not represent the end of this bull market. The NASDAQ just keeps moving along, closing today at 101.4 percent of its January 15 top. The S&P500 ended the day near that earlier level, at 99.59 percent; but the DJIA lags behind, reaching only 97.9 percent of its peak.
Comparing the profile of the S&P500, now some 23 days after the January peak, with earlier bull market highs –in today’s diagram- reveals no similarity. In fact, it allows for significant optimism for the proposition that prices will continue their ascent and soon the S&P500 and the DJIA will pass their January highs.

DJIA -.15 percent
NASDAQ .68 percent
S&P500 .12 percent
c max moszer

February 14, 2014 — Seventh NASDAQ Advance

Friday, February 14th, 2014

small latest logo

nasdaq seven day run   02142014

The price surge continues, now 21 trading days since the market fell off its all-time high. Whereas the spotlight is on the NASDAQ’s seven-day streak, the S&P500 leads this recovery. That index now stands at 99.5 percent of its January high, while the NASDAQ has come back to only 99.3 percent. The DJIA is the laggard, standing at just 98 percent.

The outlook for another positive close is chancy. While the current expansion has gone on to an eight successive gain the next day almost always, the diagram reveals that losses outnumbered gains in the two earlier bull markets.

DJIA .79 percent
NASDAQ .08 percent
S&P500 .48 percent

c max moszer

February 13, 2014 — NASDAQ Leads with Sixth Straight Gain

Thursday, February 13th, 2014

small latest logo

nasdaq six day runs  02132014

Prices across the board actually share NASDAQ’s strength, but the DJIA and the S&P500 declined yesterday. Yet their setbacks are so small, at just – .19 and .03 percent, that the NASDAQ reflects the market’s character.

The diagram shows the strong link between six-day advances and bull markets. Only four of these 57 happenings came when prices were trending down. In fact, these six-day sequences account for 1.8 percent of all bull market trading days. While this is an average frequency of once every 55 trading days, these sequences come in clusters. Moreover, quite a few appear at intermediate market tops.

There is a favorable outlook for tomorrow: the record shows seven consecutive advances occurring just about one of every two happenings.

DJIA .39 percent
NASDAQ .94 percent
S&P500 .58 percent
c max moszer