Archive for the ‘Market Report’ Category

December 12, 2013 — Prices Slip a Third Day

Thursday, December 12th, 2013

small latest logo


Three declines in a row are not that uncommon, occurring about two percent of the time.  Their frequency is somewhat larger during bear markets –with a range from 2.02 percent to 2.75 percent- while they go from 1.49 percent to 1.82 percent in bull markets.

This combination was seen last in mid-August; prices continued lower for another day then, before the NASDAQ and the S&P500 turned positive.  The DJIA decline, however, persisted; it failed to recover until the losses ran for six days in a row.

Yet there is an optimistic aspect in today’s configuration: their declines are far smaller than they have been on average.  The S&P500’s daily loss, for examples, has a mean of -1.23 percent with this pattern – about three times deeper than today’s -.38 percent.

Looking at tomorrow, prices in the past on the day following this pattern moved higher more often than they declined.


DJIA               -.66 percent

NASDAQ       -.14 percent

S&P500         -.38 percent


c max moszer

December 11, 2013 – Second Loss Follows Two Up Days

Wednesday, December 11th, 2013

small latest logo


-2 -2  -2  after +2 +2 +2              12112013


Prices fell again, posting deeper losses than yesterday.  The NASDAQ was off  -1.40 percent – suffering its worst loss since early November.  Further, this day ranks as the ninth most serious decline in 2013.  Similarly, the S&P500 decline ranks as the 15th deepest this year. 

Today’s pattern of two losses following two successive gains occurred 39 times over the last five price cycles. While our diagram shows that they cluster in falling markets, nevertheless these days also frequent bull markets.

It could be significant that several days happened near cycle turning points. In 2003  there were two , 12 and 2 two days before that cycle hit bottom.  In 2007, one took place 13 days after that expansion hit its top.  Finally, one materialized just 10 days after the 2009 bottom.

Prices fell on the following day more often than rising – in both expansion and declines.  The record shows 20 losses offset by only 12 gains in good times, while there were 7 declines compared to just 5 increases during the two bear markets. 


DJIA               -.81 percent

NASDAQ     -1.40 percent

S&P500       - 1.13 percent


c max moszer

December 10, 2013 – Another Small Change with Rare Pattern

Tuesday, December 10th, 2013

small latest logo


Prices declined following gains on the previous two days.  While changes came to less than a third of one percent, more critical is the sequence of gains and losses over the last eight trading days.  Focusing on the DJIA and the S&P500 –because of their parallel daily ups and downs- consider their recent direction changes.  They declined today, following two consecutive up days, that came after five straight declines.

Only nine other closes have this pattern since the beginning of 1996; the diagram reveals that six occurred during the last two bear markets; only two such days are in the current, since March 2009, upturn.  This history reveals this combination of daily changes is associated principally with declining prices.  This inference results from the fact that none appeared during the 2003/2007 bull market.

Looking at the following day, while the bear markets had four gains and two losses, this ratio falls to one advance and two declines for the two bull markets.

DJIA            -.33 percent

NASDAQ      -.26 percent

S&P500       -.32 percent


-1 +2 -1  after +2 +2 +2 after -5  -5 -1  12102013


December 9, 2013 – December Profile: Small Changes Are Typical

Monday, December 9th, 2013

bear and bull market changes in december


Prices moved higher for the second day in a row, a pattern seen almost as often during expansion as in contractions.  There is a significant difference though: on the following day, prices continued higher for a third day more frequently during bull markets.

Today’s gains, though, are quite small, with the S&P500 adding just .18 percent.  There are just 403 days with lesser gains, but 2000 have increased more over the last five price cycles.

December trading days, though, are marked by changes smaller than during the other eleven months of the year.  Our diagram reveals that the average positive change in December is only .12 percent. It also shows the change for each trading day of this month since the beginning of the 1996 price expansion.

Note that price changes are far smaller during bull markets; they are also less variable when prices are heading higher, with the bear market December variance more than double the bull market’s.


DJIA            .03 percent

NASDAQ    .15 percent

S&P500      .18 percent


December 6, 2013: A Strong Day – A Rare Happening

Saturday, December 7th, 2013

small latest logo


srate greater than 1.11 pct   12062013


Sharp increases of The DJIA and the S&P500 followed five consecutive declines.  The DJIA exceeded today’s 1.26 percent advance on only seven days this year.  The S&P500 has 13 days with closes higher than 1.12 percent in 2013.

Yet this performance has negative dimensions.  The diagram locating the S&P500’s 13 strong closes this year, reveals that six of these days preceded significant market declines.

Another adverse factor comes from reviewing the incidents of these large S&P500 gains over recent bull and bear markets: they occurred more frequently when prices were tending down.  In the 2007/2009 downturn, for example, one of every five days saw the S&P500 closing with gains larger than today’s 1.12 percent.  In contrast, that rate in the earlier 2003/2007 expansion was only half that, averaging less than once every 13 days.


DJIA          1.26 percent

NASDAQ     .73 percent

S&P500    1.12 percent


c max moszer

December 5, 2013 – Minimum Wage Boost Could End This Bull Market

Friday, December 6th, 2013

small latest logo


It’s a long way from McDonalds’ kitchen to Wall Street, yet once Congress enacts a higher minimum wage, stock prices are bound to suffer.          The process would start in the fast-food industry; it is the major business sector affected by, and paying its employees, the minimum wage.  While this higher labor cost will be absorbed at first, it will be passed on in higher prices eventually.

Consider the entire industry right now is in‘equilibrium.’  While every individual outlet would like to post higher prices, the fear is that rival franchisees might not go along, that they will keep prices unchanged.  That possible reaction motivates each eatery from trying to increase prices.

Yet once every vendor faces the identical cost increase that results from the higher minimum wage, each franchise can pass on that expense – and perhaps a little more – confident that all other rival establishments will follow.

Naturally, once started, it will continue; every vendor knowing that customers will consider higher prices that result from the higher minimum wage to be a reasonable escalation.

Thus the country has a new business environment – one in which every business can raise prices having found that consumers willingly go along.  And that’s when the minimum wage increase affects the stock market.

Price increases now rolling through the economy will compel the Federal Reserve to switch its policy of open market buying to open market selling.  Interest rates will shoot up and asset prices will decline.

Of course, that possible scenario does not mean the nation is satisfied with the current ‘inequality of income distribution.’  It does mean however that we must find a better way than raising the minimum wage to effect a more equitable society. 

**************

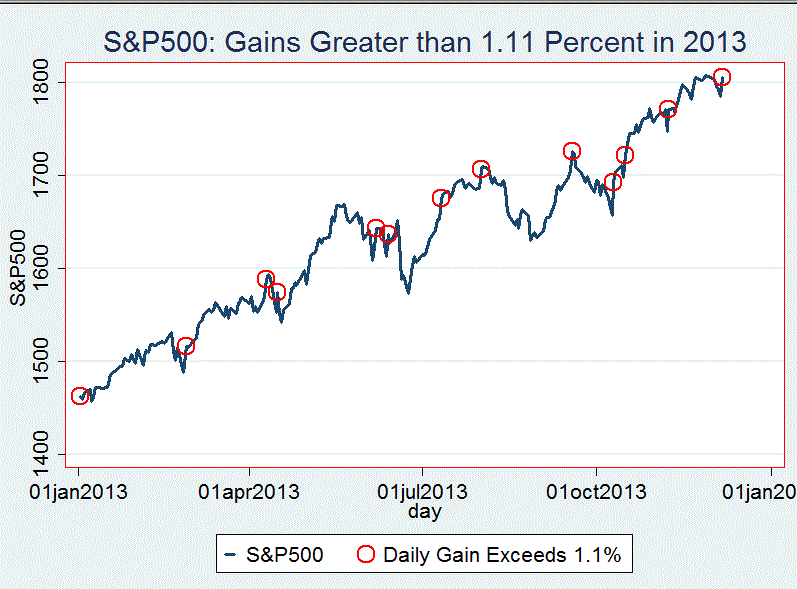
The DJIA and the S&P500 closed lower for the fifth straight session. Only 18 other days have this profile; further never before has the market experienced such a combination: a single decline for the NASDAQ joining the five losses of the other two indices.

DJIA         -.16 percent

NASDAQ     .02 percent

S&P500    -.13 percent


c max moszer

December 4, 2013 – Sixth Rate Rise, Fourth Market Drop

Wednesday, December 4th, 2013

small latest logo-4 -4 +1  first ever  diagram is for -4 -4 12042013


Unsurprisingly security prices followed the Ten Year T-Bill rate –this should not be a surprise since asset values decline as interest rates increase.  Further, with the continuing focus on the Fed’s future policy surely intensified as a new chief takes the reigns next month,  these uncertainties are bound to produce the motivation for safety that lead to  selling.

The NASDAQ went against the tide but by just a bit; it added .02 percent today, while the DJIA and the S&P500 posted losses for the fourth day in a row.  This is a first for this combination; thus without an available precedent today’s focus, by necessity, is on closes of four successive losses.

Using this diagram, we see that this pattern of four straight declines is rare; that it occurs as often in declining as in rising markets.  Yet, on the following day, prices moved up more often than they declined.

One additional curiosity is this combination occurring before market turning points: just four days before the market reached bottom in March 2009, and two days after peaking in March 2000.


DJIA         -.16 percent

NASDAQ    .02 percent

S&P500    -.13 percent


December 3, 2013 Rising T Rate Slows Stock Advance

Tuesday, December 3rd, 2013

small latest logovalue and sadj 12032013


The third loss in a row after small advances follows the rise of the interest rate of the Ten Year Treasury debt.  Today’s diagram plots the inverse or ‘value’ of the market rate for this benchmark security.  It is revealing how effective the rise in the interest rate –shown by its inverse, or dollar value, of the then year rate- has put the brakes the current bull market.  And not just now – we see this as the third recent replay of the higher interest rates-lower security values combinations that occurred this past August, September, and October.

Yet we see a positive outlook in today’s closing pattern of the DJIA and S&P500 three losses in a row, combined with two straight declines of the NASDAQ.  This is a bull market pattern since 17 of the last 21 occurrences came during bull markets.

However, the outlook for tomorrow is dim: in the past prices moved higher on nine days, they declined twelve times.


DJIA               -.59 percent

NASDAQ        -.20 percent

S&P500          -.32 percent


December 2, 2013 – The December Outlook

Monday, December 2nd, 2013

small latest logodecember and jan to nov srates  12022013


The volatility of daily price changes in December tends to be larger than during January-to-November.  During the last 13 years, the S&P500 average December daily price change comes to .08 percent, while the average rate of the January-to-November months is only .03 percent.

There is an even larger disparity when comparing these changes individually for bull and bear markets.  The December average daily change during expansions comes to .12 percent; it is only .08 during the earlier months.  In bear markets, however, the reverse is true.  The December mean daily change is only -.03 percent, while    it    is more than four times larger, some -.13 percent, throughout the earlier eleven month period when prices are declining.

The diagram plots these daily percentage changes, using a large yellow circle to designate the December days; the smaller black dots show the daily changes during January through the end of November.  The vertical lines separate bull markets from bear phases.

Today’s pattern of two losing days for the DJIA and the S&P500 while the NASDAQ declined one day occurred 53 times since 1996.  These occurred more often in bull markets than when prices were heading down.  On the following day, prices moved higher 30 times and fell on 23 days.


DJIA               -.40 percent

NASDAQ         -.29 percent

S&P500          -.17 percent


c max moszer


November 26, 2013 – Another Small Change Day

Tuesday, November 26th, 2013

small latest logo+1 +1 +4             11262013  last on 11132013


j


The DJIA added .26 points today – a change so small compared to its close of 16,072, that more decimal points than comfortable are required to size it. The S&P500’s change was not much larger, but it rounds to .01 percent. Yet the NASDAQ added .58 percent on its fourth up day in a row.

The resulting pattern of four gains for the NASDAQ combined with one day gains for the other two indices, has occurred just 21 other times.  Today’s diagram plotting these days  shows that these days favor turning points.  Look at the one happening the day after the market peaked in 2007.

The outlook for tomorrow, based on this history, is negative; there were only  six gains, compared to 15 losses on the day following this pattern.


DJIA              .00 percent

NASDAQ        .58 percent

S&P500         .01 percent


c max moszerj