![]()
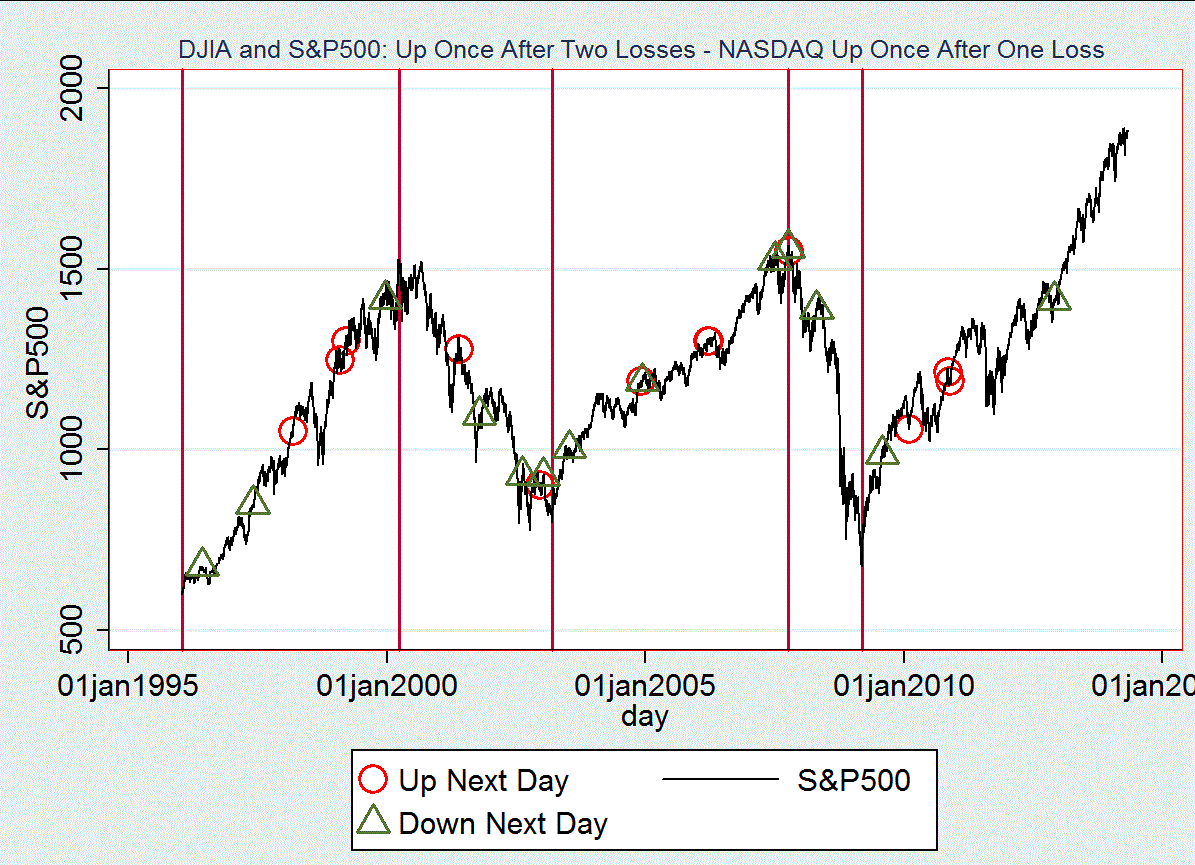
Prices moved up today with the DJIA and the S&P500 recovering from their two losing days at the end of last week. These closes, combined with the NASDAQ’s gain after its loss on Friday, yield a rarely seen pattern, but one equally common in bull and bear markets. Our diagram shows these closes with a concentration around the 2007 market peak, we note that three such closes happened just four days before the top, on the very day that prices scored their highest mark ever in October 2007, and also six days thereafter.
The S&P500 continues its fluctuation in the narrow range of 1,850-1,880 since March. Prices escaped this boundary just twice: the first time to establish a new high in April and also in their immediate decline thereafter.
On the following day in the past, prices moved higher just about as often as they declined; moreover this equality existed whether the trend of prices was up or down.
DJIA .11 percent
NASDAQ .34 percent
S&P500 .19 percent
