![]()
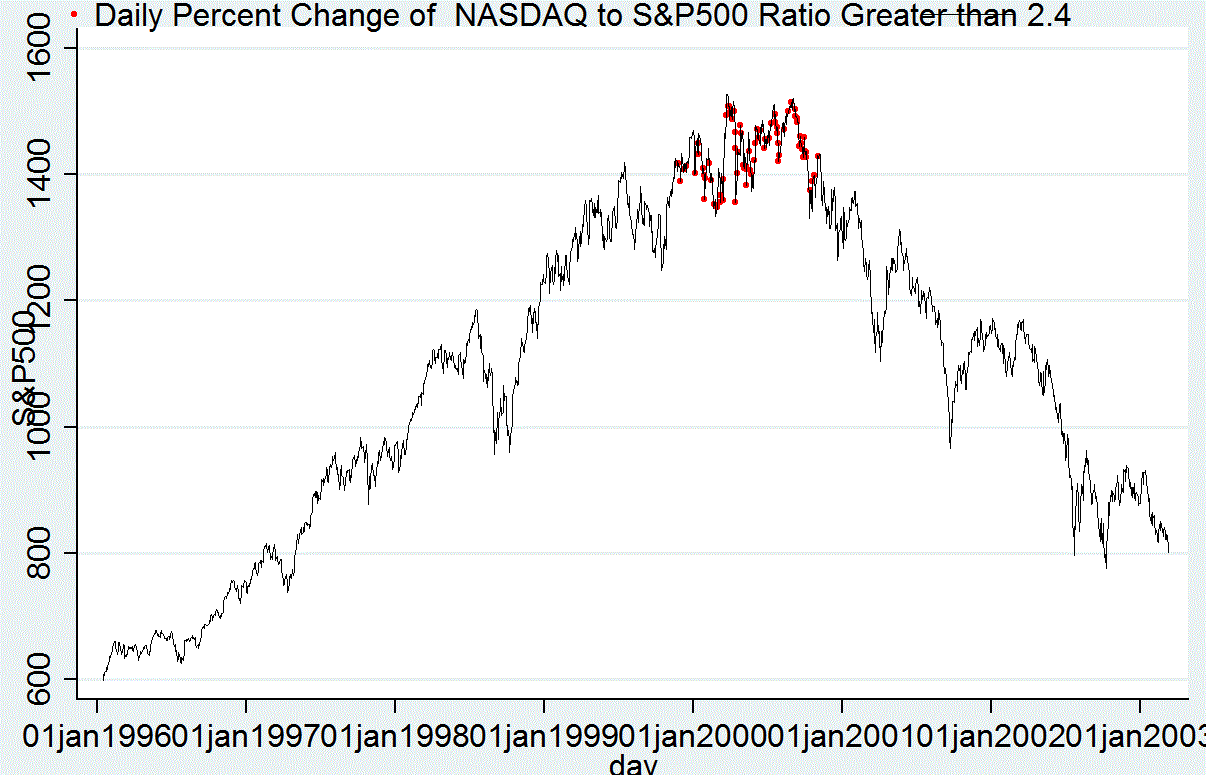
Today’s large decline of the NASDAQ of -1.18 percent is more than twice as deep as the S&P500 loss of -.49 percent. That actual ratio is 2.4 – and this happened just 85 times since 1996. Further 80 of these coincide with the end of the 2000 bull market top and the beginning of the 2000/2003 bear market.
Today’s diagram focuses on that upper turning point – is it just coincidental that all these days happened in that short, but crucial, time?
It does not seem reasonable that this simple ratio could be an indicator of bull market tops. Nevertheless, here is its history, showing the overwhelming majority of these closes happening in the twelve-month period from November 24, 1999 to November 2, 2000.
We focus on this ratio because today’s repeat is the fifth since December 30, and just ten days since the last occasion on March 12.
Yet note that the 2007 market top occurred without this feature. In fact, during that bull market the NASDAQ/S&P500 Change ratio maxed out at 1.89.
DJIA -.16 percent
NASDAQ -1.18 percent
S&P500 -.49 percent
