![]()
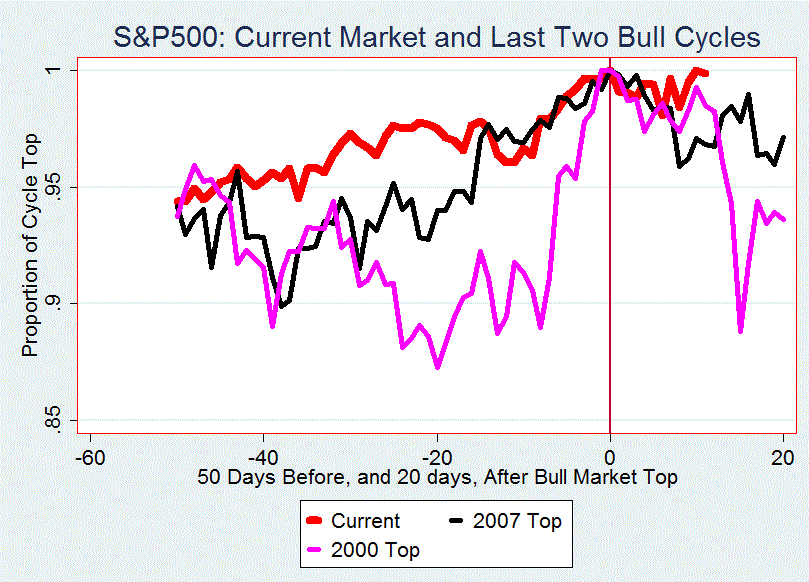
Prices continue their hover: the S&P500 remains in the 1800 to 1850 range since late November, while the December 31 close of 1848.36 has not been topped so far this year. Though market projections continue strong, the extraordinary length of the current expansion –now at 1,222 days- deserves attention. The two most recent bull markets topped out after 1,059 and 1,154 trading days.
Today’s diagram shows the daily price movements of the S&P500 fifty days before, and 20 days after, these last two bull markets. It uses the December 31, 2013 close –the highest level reached so far by the S&P500- as the current market top.
These three time paths show significant similarity, especially to the left of, that is since, their high points. However, judging a market’s momentum and projection its end based on the just eleven market days of 2014, is quite chancy; nevertheless, these parallels deserve attention.
DJIA -.39 percent
NASDAQ -.09 percent
S&P500 -.13 percent
