![]()
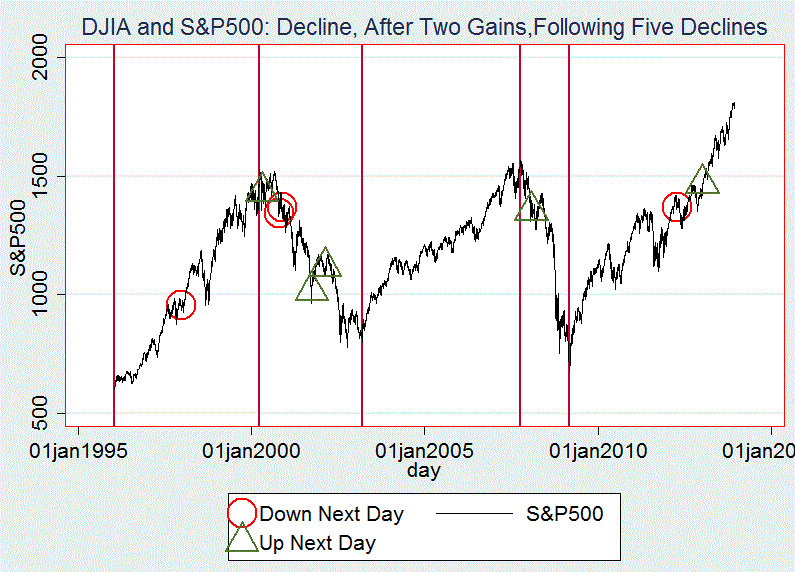
Prices declined following gains on the previous two days. While changes came to less than a third of one percent, more critical is the sequence of gains and losses over the last eight trading days. Focusing on the DJIA and the S&P500 –because of their parallel daily ups and downs- consider their recent direction changes. They declined today, following two consecutive up days, that came after five straight declines.
Only nine other closes have this pattern since the beginning of 1996; the diagram reveals that six occurred during the last two bear markets; only two such days are in the current, since March 2009, upturn. This history reveals this combination of daily changes is associated principally with declining prices. This inference results from the fact that none appeared during the 2003/2007 bull market.
Looking at the following day, while the bear markets had four gains and two losses, this ratio falls to one advance and two declines for the two bull markets.
DJIA -.33 percent
NASDAQ -.26 percent
S&P500 -.32 percent